1. 简介
我们知道,图像中的像素颜色可以用数字表示,但这些数字本身的意义是什么?它们能为我们带来什么价值?
本文将介绍什么是图像直方图,以及它在图像处理和计算机视觉中的实际应用。适合有一定图像处理基础的开发者或工程师阅读。
2. 定义
图像直方图本质上是一个二维条形图:
- 横轴表示像素的灰度值(或颜色强度),范围通常是 0~255。
- 纵轴表示该灰度值在图像中出现的频率。
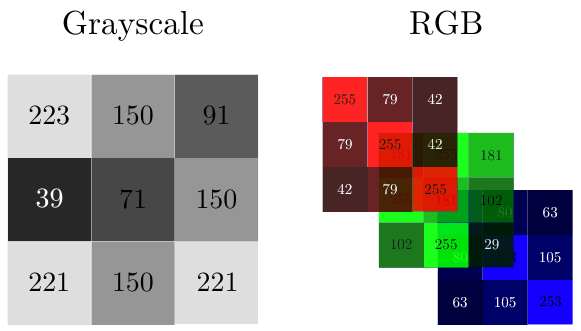
通常,我们可以将图像视为一个或多个像素矩阵:
- 灰度图:一个 0~255 的二维矩阵。
- 彩色图(如 RGB):三个通道分别对应红、绿、蓝,每个通道都是一个二维矩阵。
例如,一个 3×3 的灰度图像可以用如下矩阵表示:
2.1 直方图的构成
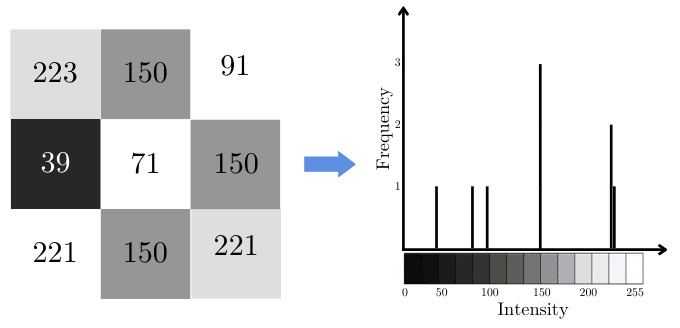
要绘制直方图,我们需要统计每个灰度值出现的次数。
例如,若某个图像中有三个像素值为 150,那么在直方图中,150 对应的柱状图高度为 3:
3. 应用场景
图像直方图在多个领域都有广泛应用,包括但不限于:
- ✅ 图像分割
- ✅ 摄影增强
- ✅ 颜色分析
下面我们来看几个典型应用。
3.1 图像分割中的直方图应用
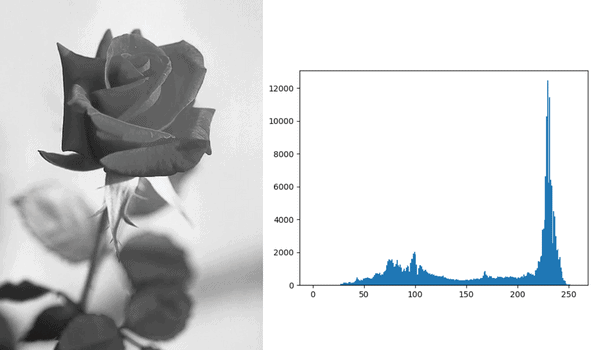
图像直方图可以帮助我们设定分割阈值,从而将目标对象与背景分离。
举个例子,我们想从背景中分离出一朵玫瑰。观察其直方图后,我们可以发现背景中大部分像素接近白色(灰度值接近 255):
如果我们设定阈值为 156,将所有大于 156 的像素视为背景,就可以得到一个二值图像:
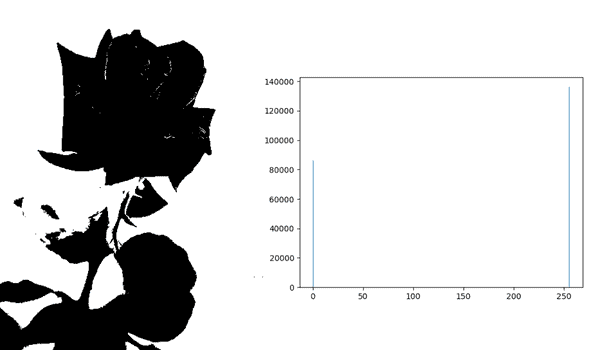
此时直方图也变为只有两个值的分布。不同的阈值会带来不同的分割结果。
3.2 摄影中的直方图应用
在摄影中,我们常通过直方图来调整图像的对比度,使图像更清晰或更具视觉吸引力。
一种常用技术是 直方图均衡化(Histogram Equalization),它通过拉伸直方图分布,使得图像的灰度值分布更均匀。
比如,原始图像如下:
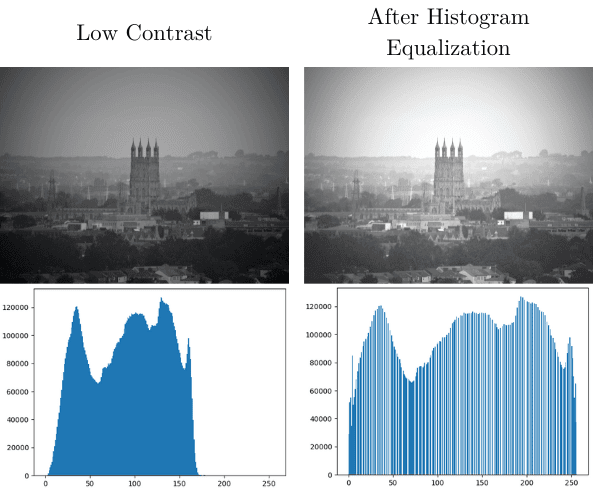
经过直方图均衡化处理后,图像的对比度明显增强,细节更清晰:
⚠️ 注意:直方图均衡化并不会增加图像的绝对信息量,而是优化其分布方式。
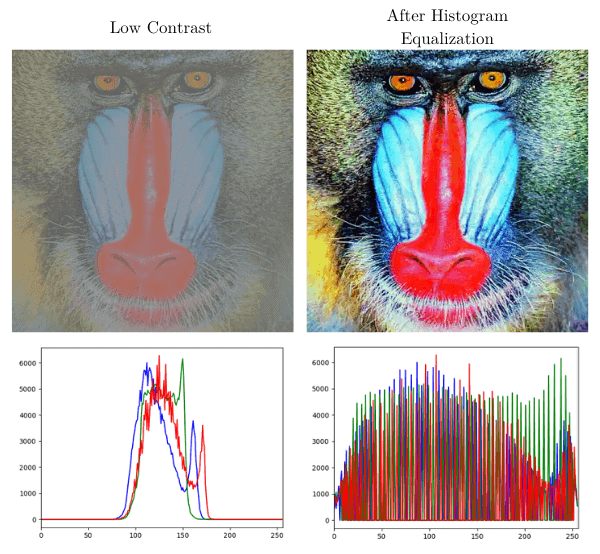
3.3 RGB 图像的直方图处理
对于彩色图像,我们通常对每个通道(R、G、B)分别进行直方图均衡化:
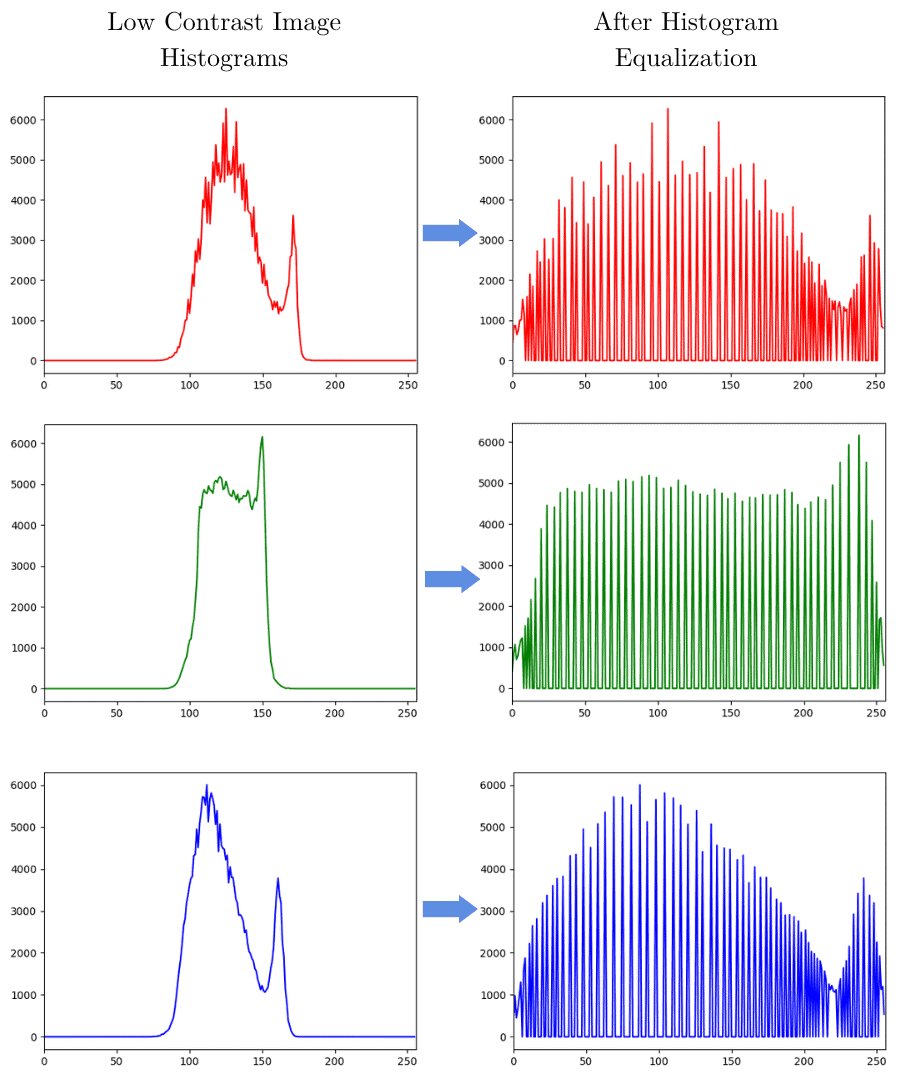
处理完成后,将三个通道重新合并,即可得到增强后的彩色图像。
这种方式虽然简单,但效果显著,尤其适用于低对比度的彩色图像。
4. 总结
图像直方图是一种简单但功能强大的工具,它可以帮助我们理解图像的亮度分布,进而用于图像增强、分割等任务。
虽然其原理简单,但在图像处理、计算机视觉和摄影等领域有着广泛的应用价值。掌握图像直方图的基本概念和使用方法,是图像处理工程师或算法开发者的必备技能之一。