1. 概述
本教程将带你深入了解 Java Flight Recorder(JFR)的基本概念、使用方式以及相关命令。我们将从工具层面出发,探讨如何利用 JFR 来采集 Java 应用运行时的底层数据。
2. Java 监控工具概览
Java 不仅仅是一门编程语言,它背后还有一个非常庞大的生态系统,其中包含了大量用于编译、调试和监控程序的工具。在 JDK 的 bin 目录下,我们可以找到以下这些常用的性能分析与监控工具:
✅ Java VisualVM(jvisualvm.exe)
✅ JConsole(jconsole.exe)
✅ Java Mission Control(jmc.exe)
✅ Diagnostic Command Tool(jcmd.exe)
⚠️ 注意:Java VisualVM 在 Java 9 之后不再随 JDK 一起发布,需要单独从 VisualVM 官网 下载安装。
本教程主要聚焦于 Java Flight Recorder(JFR)。虽然它本身不是一个独立的可执行程序,但它是与 Java Mission Control 和 jcmd 配合使用的强大工具。
3. Java Flight Recorder 基本概念
Java Flight Recorder 是一个内置于 JVM 中的高性能监控组件,它可以在应用运行期间持续采集 JVM 内部发生的事件信息。
🎯 JFR 的设计目标是尽可能减少对应用性能的影响。
启用 JFR 的方式有两种:
- 启动 Java 应用时通过参数激活;
- 应用运行后通过
jcmd工具发送诊断命令来激活。
💡 JFR 并没有自己的图形界面工具,我们需要借助 Java Mission Control(JMC)来查看和分析采集到的数据。
3.1. 事件类型
JFR 收集的事件主要分为三类:
✅ Instant Event(即时事件):事件发生即记录。
✅ Duration Event(持续事件):只有当事件持续时间超过设定阈值才会被记录。
✅ Sample Event(采样事件):定期采样系统活动,如线程状态、CPU 使用情况等。
3.2. 数据流机制
由于 JFR 采集的是高频、海量的事件数据,为了不影响应用性能,JFR 采用了缓冲机制:
❌ 磁盘 I/O 是昂贵的操作,因此 JFR 会先将数据缓存在内存中,再批量写入磁盘文件(默认为 flight.jfr)。
⚠️ 因为存在多个缓冲区并行工作的情况,输出文件中的事件顺序可能不是严格按时间排序的。不过,JMC 会自动帮你按时间重新排序展示。
🚨 极少数情况下(比如断电或事件过多),JFR 可能无法完整写入所有数据,但它会在日志中标记出可能丢失的部分。
4. 如何使用 Java Flight Recorder
JFR 在早期版本中属于商业特性,需要解锁才能使用。但从 JDK 11 开始,它已经完全开放,可以直接使用。
4.1. 命令行启动录制
以 JDK 8 为例,你需要在启动 JVM 时加上如下参数:
java -XX:+UnlockCommercialFeatures -XX:+FlightRecorder \
  -XX:StartFlightRecording=duration=200s,filename=flight.jfr \
  path-to-class-file
这个命令会立即开始录制,并在 200 秒后自动停止,数据保存在 flight.jfr 文件中。
4.2. 使用 jcmd 动态启动录制
如果应用已经在运行,可以通过 jcmd 来控制 JFR:
jcmd 1234 JFR.start duration=100s filename=flight.jfr
其中 1234 是目标 Java 进程的 PID。
jcmd 常用命令一览:
✅ JFR.start – 启动新的录制
✅ JFR.check – 查看当前正在运行的录制任务
✅ JFR.stop – 停止某个录制任务
✅ JFR.dump – 将录制内容导出到文件
JFR.start 支持的主要参数:
| 参数名 | 描述 |
|---|---|
| name | 录制名称,用于后续引用 |
| delay | 延迟多久开始录制,默认 0s |
| duration | 录制持续时间,默认 0s 表示无限制 |
| filename | 输出文件名 |
| maxage | 数据最大保留时间 |
| maxsize | 数据最大大小(字节) |
📌 建议设置 duration、maxage 或 maxsize 中至少一个,避免占用过多资源。
5. 实战演示:JFR 使用示例
我们来看一个简单的例子,模拟内存溢出场景,并使用 JFR 分析其行为。
5.1. 示例代码
public static void main(String[] args) {
    List<Object> items = new ArrayList<>(1);
    try {
        while (true){
            items.add(new Object());
        }
    } catch (OutOfMemoryError e){
        System.out.println(e.getMessage());
    }
    assert items.size() > 0;
    try {
        Thread.sleep(1000);
    } catch (InterruptedException e) {
        System.out.println(e.getMessage());
    }
}
这段代码会不断向列表中添加对象,直到触发 OutOfMemoryError,然后休眠一秒。
5.2. 启动录制
首先编译代码:
javac -d out -sourcepath src/main src/main/com/baeldung/flightrecorder/FlightRecorder.java
然后启动录制:
java -XX:+UnlockCommercialFeatures -XX:+FlightRecorder \
  -XX:StartFlightRecording=duration=200s,filename=flight.jfr \
  -cp ./out/ com.baeldung.flightrecorder.FlightRecorder
5.3. 查看分析结果
使用 Java Mission Control(JMC) 打开生成的 flight.jfr 文件,可以直观看到如下信息:
CPU 使用情况
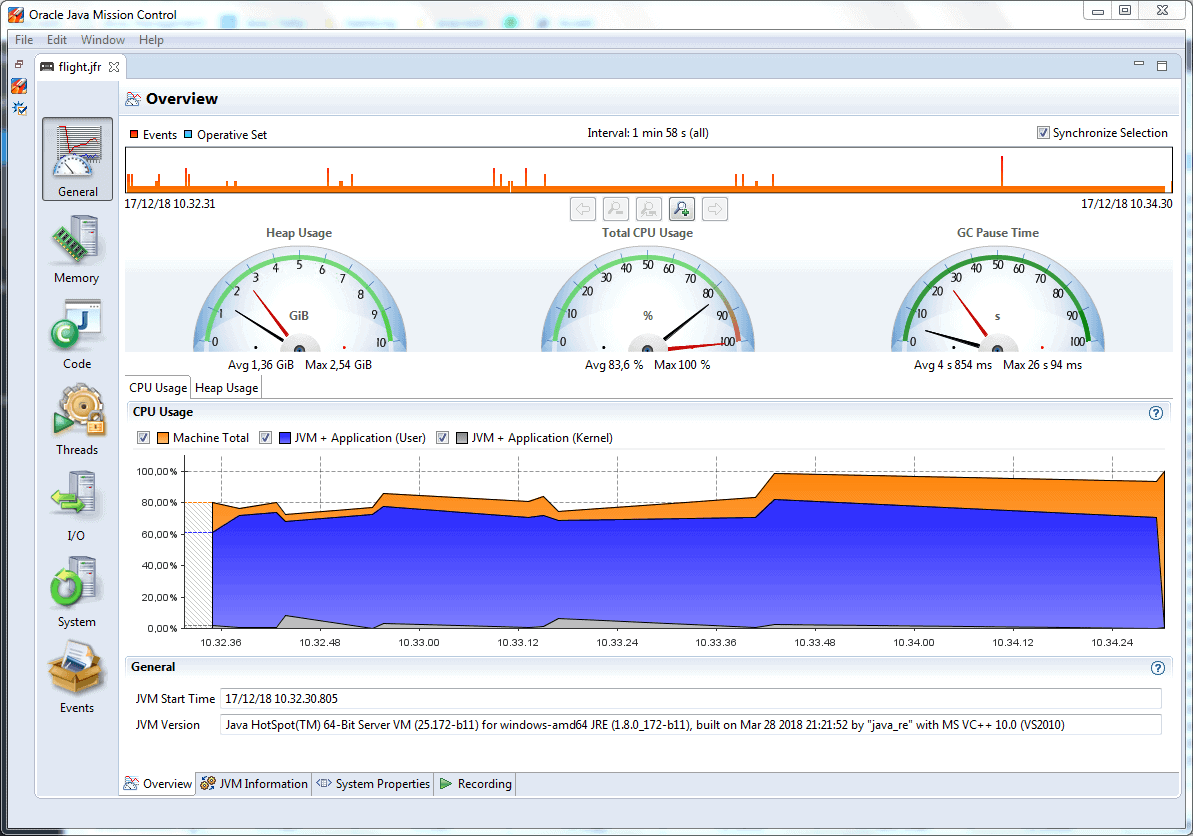
可以看到 CPU 负载非常高,这正是由于死循环导致的。
方法热点分析

可以看到 ArrayList.grow() 被频繁调用,说明数组在不断扩容。
此外还可以看到:
✅ 对象创建频率和生命周期
✅ 线程活动状态
✅ I/O 操作详情
这些信息在实际排查性能瓶颈或内存泄漏问题时非常有价值。
6. 总结
Java Flight Recorder 是一个功能强大、低侵入性的监控工具,尤其适合在生产环境中进行问题诊断和性能调优。
虽然它仍处于实验阶段,但随着 JDK 版本迭代,其稳定性和可用性不断提升。
📚 更详细的使用文档请参考 Oracle 官方 JFR 文档。
📦 示例代码可在 GitHub 获取:https://github.com/eugenp/tutorials/tree/master/core-java-modules/core-java-perf