1. 简介
在如今的应用场景中,同时服务成千上万甚至百万级用户已经不是什么稀罕事。这类应用往往需要巨大的内存支持,而内存管理的效率直接影响到应用性能。
为了解决这个问题,Java 11 引入了 ZGC(Z Garbage Collector) 作为一个实验性的垃圾收集器实现。随后,在 JEP-377 的推动下,ZGC 在 JDK 15 中正式成为生产可用的功能。
本文将带你深入了解 ZGC 是如何在多 TB 级别的堆内存中依然保持极低的暂停时间。
2. 核心概念
要理解 ZGC 的工作机制,我们首先需要了解一些内存管理和垃圾回收的基础知识。
2.1. 内存管理
物理内存即我们硬件上的 RAM。
操作系统(OS)会为每个应用分配虚拟内存空间。
当然,虚拟内存是存储在物理内存中的,操作系统负责维护虚拟地址与物理地址之间的映射关系,通常借助硬件加速完成。
2.2. 多映射(Multi-Mapping)
多映射指的是:虚拟内存中的多个地址指向同一个物理内存地址。由于应用程序通过虚拟内存访问数据,它们对此机制一无所知(也不需要知道)。
简单来说,就是将虚拟内存的多个区域映射到物理内存的同一块区域:
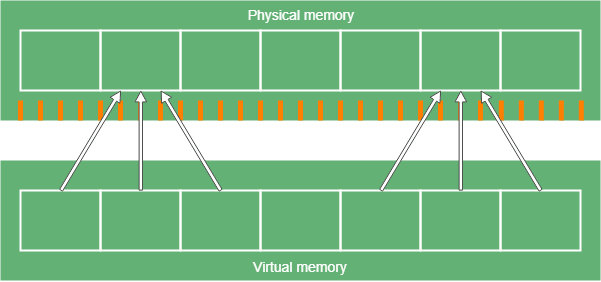
乍一看这种机制似乎用处不大,但后面我们会看到,ZGC 正是借助它来实现其“魔法”功能。此外,它还能提供一定的安全隔离能力。
2.3. 内存重定位(Relocation)
动态内存分配会导致内存碎片化。当我们在内存中间释放一个对象时,就会留下一个空洞;随着程序运行,这些空洞会越来越多,最终内存就像一块被切得乱七八糟的棋盘。
虽然我们可以通过扫描内存找到足够大的空闲块来分配新对象,但这操作成本高,而且依然无法彻底解决碎片问题。
另一个策略是:将碎片化的内存区域中的对象集中迁移到新的连续区域,以减少碎片。ZGC 采用的就是这种方式,并且为了提高效率,它按块(region)来处理,要么整个块都迁移,要么不动。
2.4. 垃圾回收(Garbage Collection)
Java 应用无需手动释放内存,因为 GC 会自动处理。GC 的核心任务是追踪堆中对象的可达性:如果一个对象无法通过引用链访问到,它就是垃圾,可以被回收。
GC 需要维护对象的状态,比如:
- reachable(可达):对象被应用持有引用,可能是间接引用。
- finalizable(可终结):对象不可达,但有
finalize()方法待执行。

为了完成这些任务,GC 通常会分为多个阶段。
2.5. GC 阶段的特性
GC 的各个阶段可能具备如下特性:
- ✅ parallel(并行):多个 GC 线程同时运行
- ❌ serial(串行):单线程执行
- ⚠️ stop-the-world(STW):暂停应用线程
- ✅ concurrent(并发):与应用线程同时运行
- ✅ incremental(增量):可以中途暂停,后续继续
这些特性各有优劣。例如,并发阶段如果用串行执行可能只需 1% 的 CPU 资源,耗时 1000ms;而并行执行虽然只需要 50ms,但会占用 30% 的 CPU。对于 CPU 敏感型应用(如批处理任务),这种额外开销可能得不偿失。
因此,选择合适的 GC 策略必须结合应用的实际情况。
3. ZGC 的设计理念
ZGC 的目标是尽可能缩短 STW 阶段的暂停时间,并且这个暂停时间不会随着堆大小的增加而增长。✅ 这使得 ZGC 非常适合需要大堆、低延迟的服务器应用。
在传统 GC 技术基础上,ZGC 引入了几个关键创新,我们接下来一一介绍。
3.1. 整体架构
ZGC 的工作流程大致如下:
- 标记阶段(Marking):找出所有可达对象。
- 重定位阶段(Relocation):将对象从碎片区域迁移到新区域。
- 重映射(Remapping):更新旧引用指向新地址。
ZGC 采用了一种非常巧妙的方式存储对象状态:通过引用本身携带元数据,即“引用着色(Reference Coloring)”。
但这也带来新问题:多个引用可能指向同一个对象的不同状态。为了解决这个问题,ZGC 利用了多映射机制。
同时,为了避免内存碎片,ZGC 会并发地执行对象重定位。但这也带来了新的挑战:当对象被迁移后,旧引用如何指向新地址?
ZGC 通过 Load Barrier(加载屏障) 来解决这个问题。每当应用加载一个引用时,Load Barrier 会检查并更新引用,确保始终访问到最新地址。
3.2. 标记阶段(Marking)
ZGC 的标记分为三个阶段:
- STW 阶段:扫描根引用(如局部变量、静态字段)并标记。
- 并发阶段:从根引用开始遍历对象图,标记可达对象。Load Barrier 也会参与标记。
- STW 阶段:处理一些边缘情况,如弱引用。
ZGC 使用 marked0 和 marked1 两个元数据位来记录标记状态。
3.3. 引用着色(Reference Coloring)
引用本质上是虚拟内存中的一个地址。在 64 位系统中,ZGC 使用 64 位指针,其中:
- ✅ 42 位表示实际地址(可寻址 4TB)
- ✅ 4 位用于存储元数据(状态位)

这 4 个元数据位分别是:
- finalizable:对象仅通过终结器可达
- remap:引用已更新,指向对象当前位置
- marked0 / marked1:标记对象是否可达
在 ZGC 中,这些位中只有一个为 1,用于表示当前引用的状态。
3.4. 重定位(Relocation)
ZGC 的重定位包括以下步骤:
- 并发阶段:选择需要迁移的内存块(relocation set)。
- STW 阶段:迁移根引用并更新其指向。
- 并发阶段:迁移其余对象,并将旧地址到新地址的映射存入 forwarding table。
- 下一次标记阶段:更新其他引用(也可以由 Load Barrier 完成)。
⚠️ 在 JDK 16 之前,ZGC 依赖预留堆空间来完成重定位。从 JDK 16 开始,支持原地重定位,有效避免了堆满时的 OutOfMemoryError。
3.5. 重映射与 Load Barrier
在重定位阶段,大多数引用并未更新。如果直接使用这些旧引用,会导致访问错误或访问到垃圾数据。
ZGC 通过 Load Barrier 实现引用的自动更新,这个过程称为 Remapping。每当应用加载一个引用时,Load Barrier 会执行以下逻辑:
- 如果
remap位为 1,则直接返回引用。 - 如果对象不在重定位集中,则设置
remap位并返回。 - 如果对象已被重定位,则更新引用地址并设置
remap位。 - 如果尚未重定位,则先迁移对象,再更新引用。
虽然 Load Barrier 会带来一定性能开销,但由于其执行速度快,整体影响不大。这是 ZGC 实现低延迟的代价之一。
4. 如何启用 ZGC?
✅ JDK 15 及以上版本,只需添加以下 JVM 参数即可启用 ZGC:
java -XX:+UseZGC <java_application>
⚠️ JDK 15 之前,ZGC 是实验性功能,需要额外添加参数:
java -XX:+UnlockExperimentalVMOptions -XX:+UseZGC <java_application>
建议使用最新的 LTS 版本 JDK,以获得更好的稳定性和功能支持。
5. 最新特性
5.1. 支持 NVRAM 堆(Heap on NVRAM)
随着 NVRAM 技术的发展,ZGC 从 JDK 15 开始支持将 Java 堆存储在 NVRAM 上,显著降低成本。
使用方式:
--XX:AllocateHeapAt=<path>
5.2. 毫秒以下暂停时间
ZGC 的目标是将暂停时间控制在 10ms 以内,JDK 16 已实现 O(1) 级别的暂停时间,低于 1ms,且不受堆大小影响。
关键技术是 Stack Watermark Barrier,支持并发扫描线程栈。
5.3. 压缩类指针与类数据共享
JDK 15 中,ZGC 支持:
- Compressed Class Pointers:压缩类指针,减少堆内存占用。
- Class Data Sharing(CDS):提升启动速度,降低内存占用。
5.4. 动态 GC 线程数
JDK 17 中,ZGC 支持动态调整 GC 线程数量,避免 CPU 资源浪费:
-XX:+UseDynamicNumberOfGCThreads
-XX:ConcGCThreads=<number>
5.5. 快速 JVM 终止
JDK 17 中优化了 ZGC 的终止逻辑,通过中断 GC 周期快速进入安全状态,使 JVM 终止几乎瞬时完成。
6. 总结
ZGC 是一款面向大堆、低延迟场景的现代垃圾收集器。它通过以下技术实现目标:
- ✅ 引用着色(Reference Coloring)
- ✅ Load Barrier
- ✅ 并发重定位(Relocation)
- ✅ 动态重映射(Remapping)
如果你的应用对响应时间要求极高,且堆内存较大,ZGC 是一个非常值得尝试的选择。