1. Overview
Social Network Analysis (SNA) is a methodological approach for exploring and visualizing the relationships and interactions within a network. It typically focuses on how individuals or entities are connected and influence each other.
It’s a multidisciplinary field with roots in sociology, anthropology, social psychology, computer science, and mathematics. It has evolved through the contributions of various scholars throughout the 20th century.
In this tutorial, we’ll explore the basic concepts of SNA and its applications in today’s world.
2. Goals of Social Network Analysis
SNA unravels the complex web of relationships within social systems, enabling a deeper understanding of how information, influence, and resources flow between individuals or entities. It provides a framework for capturing the interdependencies and interactions that shape social dynamics, making it invaluable in contexts where understanding relationships is critical:
- SNA helps identify informal networks in an organization
- It can reveal influencers who may not have formal titles but are critical to the decision-making process
- In public health, it can track the spread of diseases or behaviors, helping to design more effective interventions
- It allows companies to target influential customers who can amplify brand messages
The importance of SNA has grown exponentially in the digital age. With the rise of social media, online platforms, and digital communication, people generate massive amounts of data every second. Integrating big data and machine learning has further enhanced the capabilities of modern SNA, allowing it to handle complex, large-scale networks.
3. Social Network as a Graph
A social network is a structure consisting of nodes connected by edges:
- Nodes are individual entities within a network, such as people, organizations, or other distinct entities interacting within a system.
- Edges represent the connections between nodes, such as friendships, professional relationships, or any form of interaction or communication.
In plots, nodes are usually shown as points or circles, and edges as lines in undirected or arrows in directed graphs:
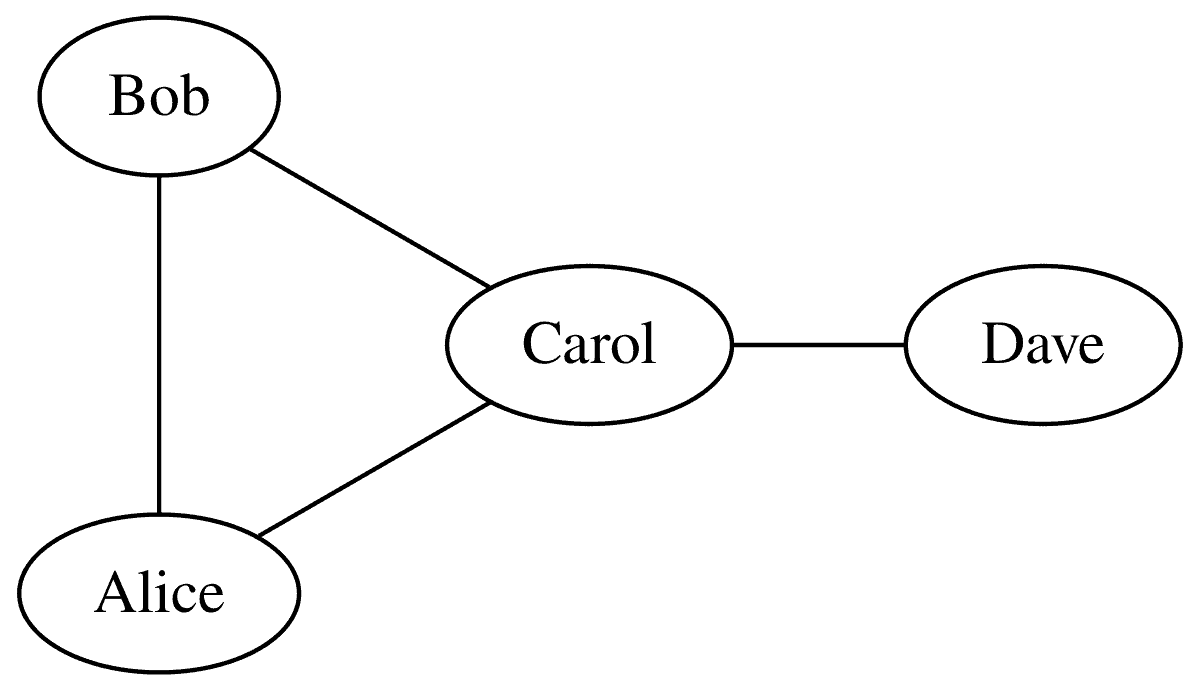
This graph shows a simple network with four nodes (social media accounts): Alice, Bob, Carol, and Dave. These nodes are connected by edges, denoting friendship. Alice is connected to both Bob and Carol, Bob is connected to Carol and Alice, and Carol is connected to Dave, Bob, and Alice.
One question we might ask about such a graph is which node is the most central or influential in the network. Intuitively, Carol appears to be that node. In general, we can answer such questions more accurately and methodically with a centrality measure, such as betweenness or degree centrality. Let’s explore them.
4. Centrality Measures
4.1. Degree Centrality
The in-degree centrality is the number of edges directed toward a node, and the out-degree centrality is the number of edges directed away from a node. This distinction is important in networks with directed edges, where each edge has a specific direction from one node to another.
For example, a directed edge from node A to node B in a social media network might represent A following B. Thus, in-degree centrality measures a node’s number of followers, and out-degree centrality measures the number of accounts it follows.
Let’s take an example:
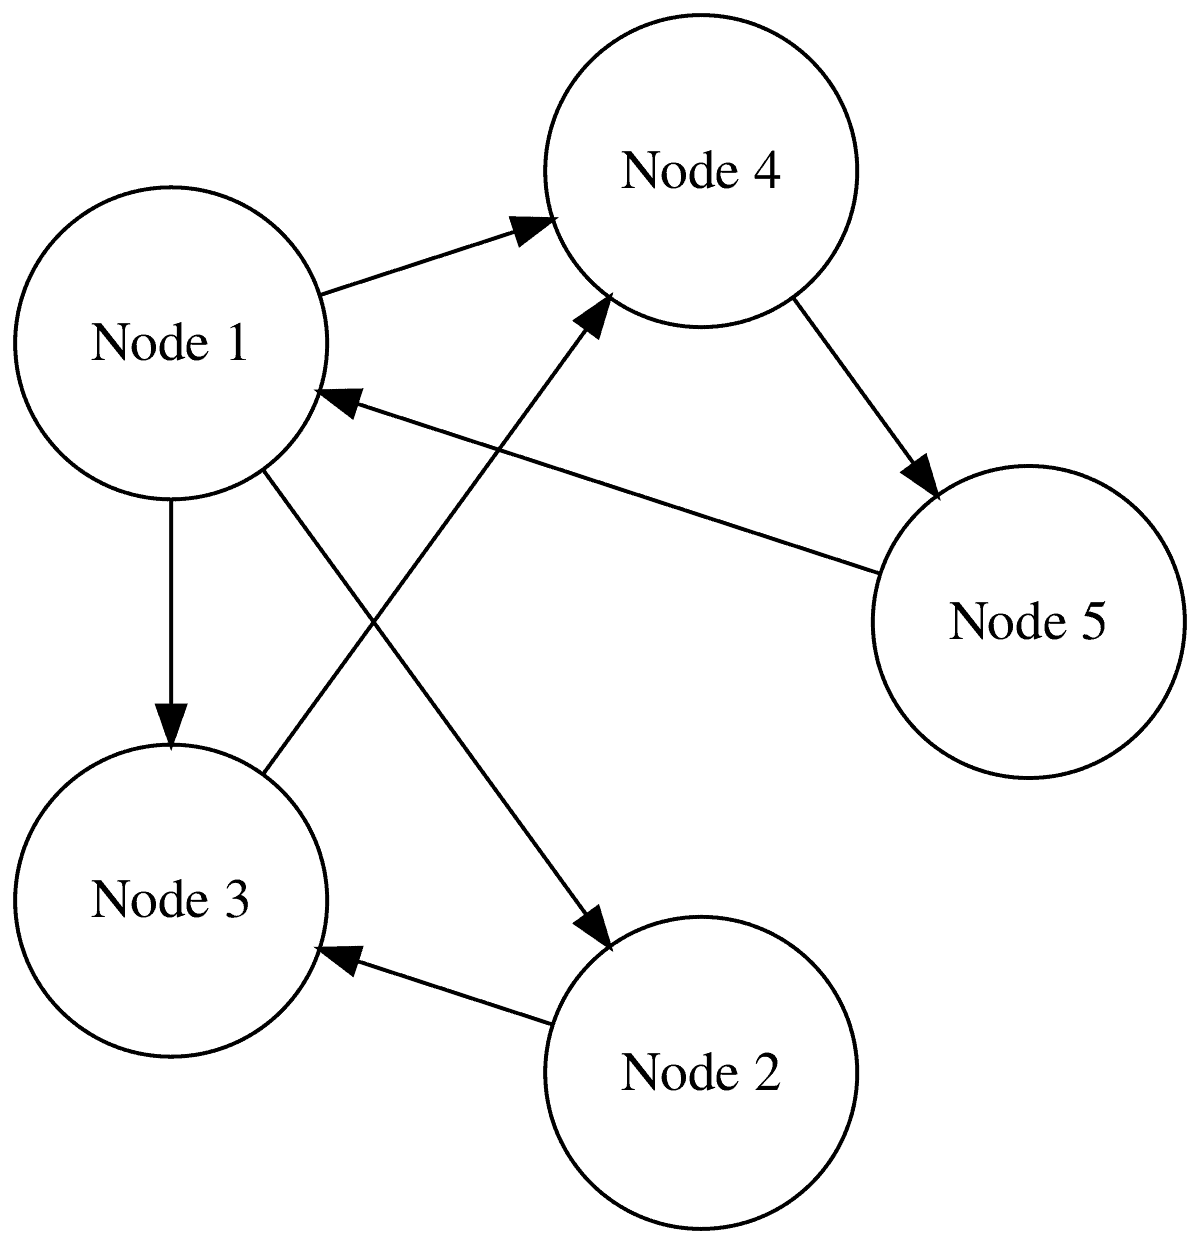
Node 1 has an out-degree centrality of 3 and an in-degree centrality of 1.
In social media, nodes with higher in-degree centrality are often more influential because they have more followers. In the graph above, Node 4 has the most followers.
However, if the edges aren’t directed, we can use degree centrality, which counts a node’s connections (without considering the direction of the edges). In our example, Node 1 has a degree centrality equal to 4.
4.2. Betweenness Centrality
Betweenness centrality is proportional to the number of all shortest paths between pairs of other nodes that pass through the given node. Essentially, a node with high betweenness centrality has significant control over the flow of information within the network because it lies on many of the shortest paths connecting different pairs of nodes.
For instance:
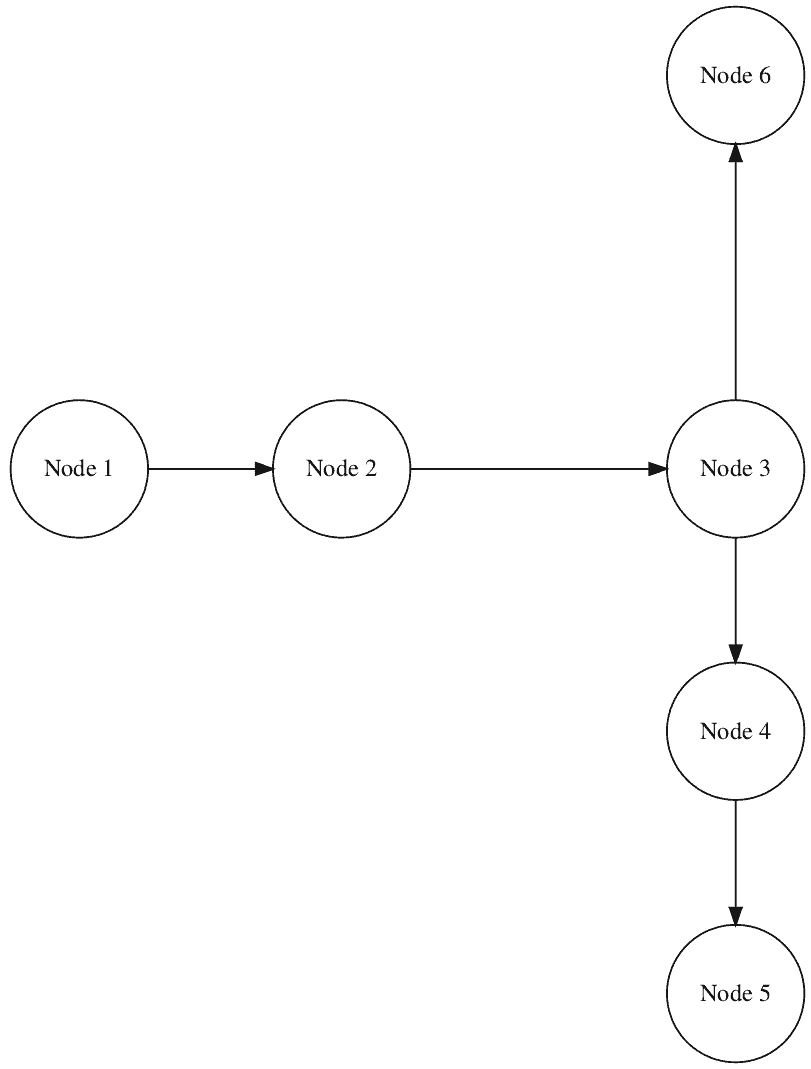
In this diagram, Node 3 has the highest betweenness centrality, as it lies on the shortest path between several pairs of nodes, such as Node 2 and Node 4, as well as 1 and 4, 1 and 5, 1 and 6, 2 and 6, 4 and 6, 5 and 6. If Node 3 were removed, the network would become disconnected, demonstrating its importance as a bridge.
Nodes with high betweenness centrality act as bridges, controlling the flow of information between different parts of the network. They are critical to maintaining the network’s integrity.
For example, individuals with high betweenness centrality may have significant power in organizational networks because they connect different departments or groups.
4.3. Closeness Centrality
Closeness centrality measures how close a node is to all other nodes in the network. It’s calculated as the reciprocal of the sum of the shortest path distances from the node to all other nodes. Nodes with high closeness centrality can efficiently spread information throughout the network.
Let’s check out an example:
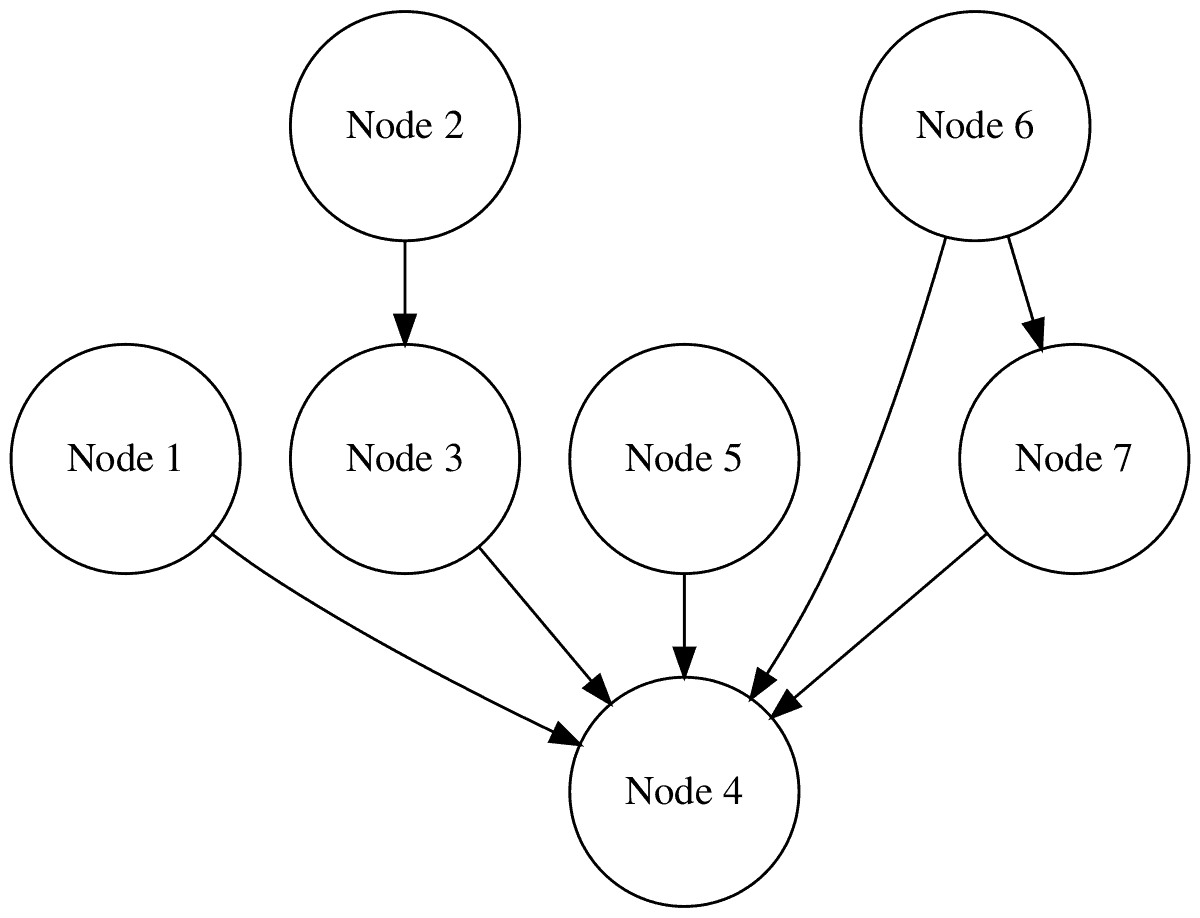
In this diagram, Node 4 has a high closeness centrality, as it’s relatively close to all other nodes in the network, making it a key node for rapid information dissemination.
In practical scenarios, nodes with high closeness centrality often represent strategic positions, objects, or entities. For example, individuals with high closeness centrality in emergency response networks can efficiently coordinate and distribute critical information to all network elements.
5. Community Detection Basics
Community detection identifies groups of nodes more connected to each other than to the rest. These communities can reveal underlying structures or subgroups, such as cliques of friends in a social network or clusters of related documents in a citation network.
Here’s a visual example:
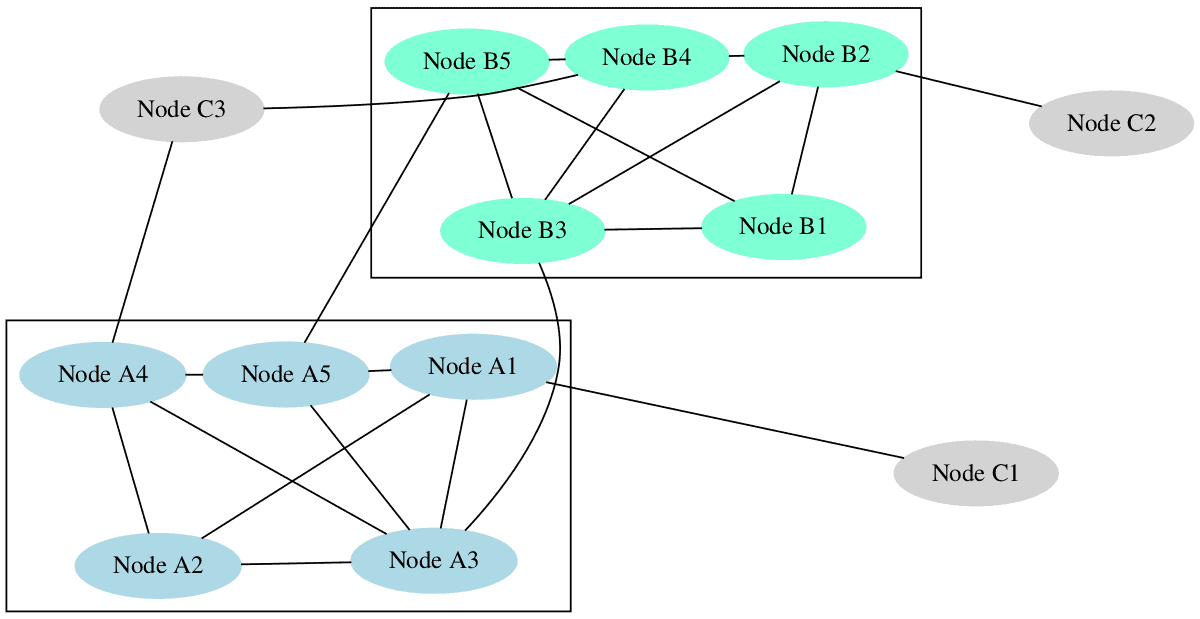 In this case, we have two distinct communities, Community A (light blue nodes) and Community B (aquamarine nodes), with a set of external nodes.
The nodes in Community A are interconnected so that each node is directly connected to several others within the same group, illustrating strong intra-community ties. We see the same pattern in Community B.
Some inter-community connections exist between the two communities, specifically between nodes A3 and B3 and between nodes A5 and B5. These connections show that while the communities are mostly independent, they still maintain some level of interaction, which is often seen in real-world networks.
External (light gray) nodes C1, C2, and C3 are sparsely connected to the communities. While they are part of the overall network, they aren’t strongly affiliated with either community.
Understanding communities within a network can be critical for targeted interventions. For example, identifying and targeting key communities can increase a marketing campaign’s impact. In epidemiology, understanding how a disease spreads within communities can lead to more effective containment strategies.
6. SNA and Social Media
6.1. Applications
SNA has been instrumental in uncovering how information spreads across social media platforms and identifying key influencers who drive conversations and trends. A notable case study is the analysis of Twitter content around the 2020 and 2022 presidential elections in the United States and South Korea.
Another interesting research is the use of SNA and SA (Semantic Analysis) on Twitter to study the support networks of political leaders. This research demonstrates that by integrating SNA with methods such as Naive Bayes and Support Vector Machines (SVM), it’s possible to predict political outcomes and more accurately assess the influence of individuals within political networks. The study highlights the effectiveness of these combined approaches in real-world scenarios, where they can aid strategic decision-making despite the challenges posed by unstructured data and the complexity of social media content.
Similarly, in marketing, companies use SNA to identify brand advocates whose network connections can effectively promote products to a broader audience.
Public health is another area in which SNA has proven valuable. Health organizations use SNA to track the spread of disease through social networks and identify key individuals or groups who are most at risk or who play a critical role in transmission. SNA has many other applications, such as identifying support networks for chronic diseases.
6.2. Risks
However, using SNA in social media raises ethical considerations, particularly concerning privacy and potential manipulations.
The ability to map relationships and interactions in detail can lead to concerns about surveillance and misuse of personal data. There is also the risk of manipulating networks to spread misinformation or influence public opinion, as seen in various disinformation campaigns.
7. Conclusion
In this article, we explored the basic concepts and applications of SNA. Starting with an overview of SNA, we highlighted its value for analyzing and visualizing relationships within networks.
SNA plays a critical role in social media, marketing, public health, and beyond, helping identify key influencers, track the spread of information or disease, and optimize targeted interventions.