1. Overview
In this tutorial, we’ll examine the process of using Java Flight Recorder to record events during Hibernate lifecycle execution. After that, we’ll use the JDK Mission Control tool from Oracle to inspect the recorded events and gain insights into Hibernate’s internal execution.
2. Introduction to Java Flight Recorder and JDK Mission Control
Java Flight Recorder (JFR) is a low-level agent provided by the Hotspot virtual machine from Oracle, OpenJDK, and Oracle JDK. It’s useful for monitoring Java applications.
The Java Flight Recorder agent records events generated from Java Virtual Machine and supported frameworks like Hibernate during the application execution. JFR records the generated events into a file, that can be analyzed and visualized using the JDK Mission Control tool from Oracle.
3. Configure an Application to Emit Hibernate-JFR Events
Hibernate ORM doesn’t emit any Java Flight Recorder events out of the box. To enable the generation of events from Hibernate, we must add hibernate-jfr dependency to our pom.xml file:
<dependency>
    <groupId>org.hibernate.orm</groupId>
    <artifactId>hibernate-jfr</artifactId>
    <version>6.4.4.Final</version>
</dependency>
Notably, the hibernate-jfr jar is only available since Hibernate 6.4.
3.1. Configuring a Sample Spring Boot Application
Now let’s create a sample Spring Boot application with spring-data-jpa and ehcache as the Hibernate L2 cache to demonstrate the Hibernate JFR events. The Spring Boot version we’ll use in this example is 3.1.5.
The sample application uses the H2 database. We can use the Spring configuration below to configure Hibernate for such a use case:
spring:
  h2:
    console.enabled: true
  datasource:
    url: jdbc:h2:mem:hibernatejfr
    username: sa
    password: password
    driverClassName: org.h2.Driver
  jpa:
    database-platform: org.hibernate.dialect.H2Dialect
    defer-datasource-initialization: true
    show-sql: true # Print SQL statements
    properties:
      hibernate:
        format_sql: true
        generate_statistics: true
        ## Enable jdbc batch inserts
        jdbc.batch_size: 4
        order_inserts: true
        javax.cache.provider: org.ehcache.jsr107.EhcacheCachingProvider
        ## Enable L2 cache
        cache:
          region.factory_class: org.hibernate.cache.jcache.JCacheRegionFactory
          use_second_level_cache: true
          use_query_cache: true
      jakarta.persistence.sharedCache.mode: ENABLE_SELECTIVE
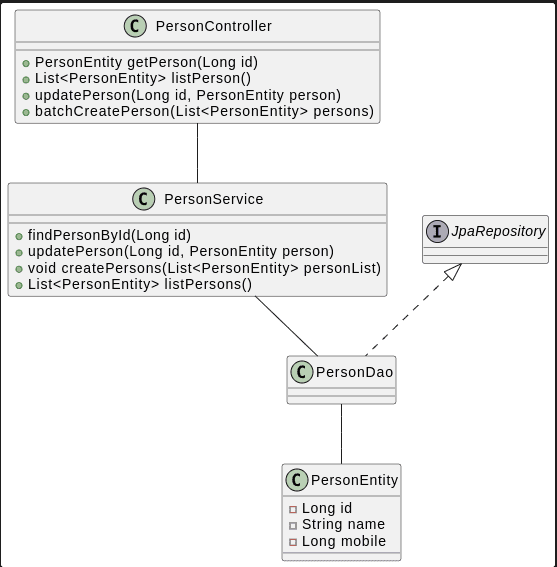
We’ll create a simple Spring Boot application using Spring JPA and Hibernate 6 as the ORM layer to demonstrate the JFR events. For brevity, we present only the class diagram of the demo app:
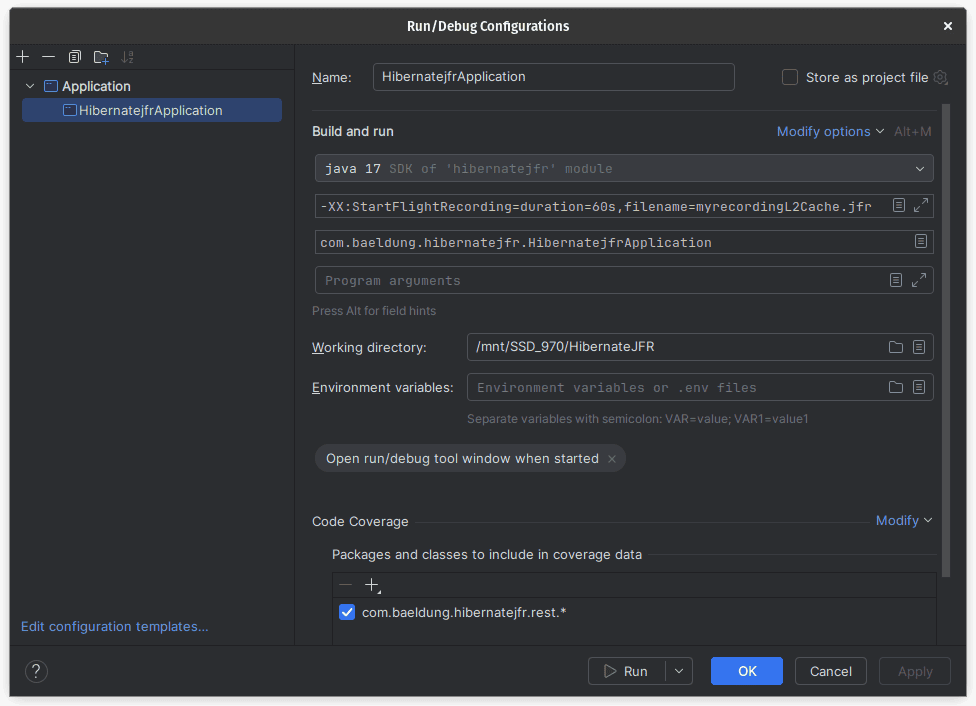
Once the application is configured, let’s start the application in flight recording mode by passing -XX:StartFlightRecording as VM arguments when starting the application:
java -XX:StartFlightRecording=filename=myrecordingL2Cache.jfr -jar hibernatejfr-0.0.1-SNAPSHOT.jar
If we’re using IntelliJ Idea to launch the application, we may add the -XX:StartFlightRecording VM argument through the IDE Run/Debug Configurations:
Now the application is ready to run. First, we’ll start the demo application and hit a few REST endpoints using cURL or PostMan. Then, we’ll stop the application and verify that the recording is saved in the specified file.
Alternatively, if we want to capture the events when running unit test cases, it’s possible to use the maven-surefire-plugin to apply the VM argument to start flight recording during test case execution.
3.2. Configuring Logs
We can enable the Hibernate configuration property hibernate.generate_statistics to generate logs that print stats for actions like L2C cache hits and JDBC connections. We can use these logs to verify that the L2 cache is set up correctly.
The Flight Recorder prints logs at the start of the application when the recording is enabled. Therefore, we should look out for log lines that confirm JFR recording is running:
[0.444s][info][jfr,startup] Started recording 1. No limit specified, using maxsize=250MB as default.
[0.444s][info][jfr,startup]
[0.444s][info][jfr,startup] Use jcmd 27465 JFR.dump name=1 to copy recording data to file.
4. Types of Hibernate JFR Events
The hibernate-jfr jar defines the events produced by Hibernate during flight recording and, it follows the SPI mechanism to plug itself into the Hibernate lifecycle. The Service Provider Interface (SPI) architecture in Java provides a great way to promote extensibility, loose coupling, modularity, and plugin architecture.
The hibernate-core jar declares the Service Provider Interface (SPI) org.hibernate.event.spi.EventManager, which the JFR jar implements. Hence, when Hibernate detects the presence of hibernate-jfr jar in the classpath, Hibernate registers it and emits the JFR events during execution.
The following events are defined in hibernate-jfr jar:
- CacheGetEvent
- CachePutEvent
- DirtyCalculationEvent
- FlushEvent
- JdbcBatchExecutionEvent
- JdbcConnectionAcquisitionEvent
- JdbcConnectionReleaseEvent
- JdbcPreparedStatementCreationEvent
- JdbcPreparedStatementExecutionEvent
- PartialFlushEvent
- SessionClosedEvent
- SessionOpenEvent
We can see that the names of these events are self-explanatory. However, some events, such as CacheGetEvent and CachePutEvent, are published only if a Level 2 cache is configured. Likewise, JdbcBatchExecutionEvent is published when a JDBC query is executed in batch mode.
Additionally, each of the above Hibernate JFR events has properties to describe the detail of the emitted event. For example, the SessionOpenEvent has the following properties:
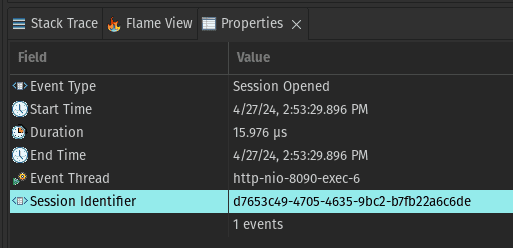
Hibernate collects different properties for different types of events. Some important properties critical for analysis are Start Time, Duration, End Time, and Event Thread. Session Identifier is another important property but hibernate doesn’t collect it for all event types.
5. Analysis of JFR Events Using JDK Mission Control
Now that we have a JFR file ready for analysis, let’s dive into JDK Mission Control to analyze the JFR file.
5.1. Finding the Hibernate ORM Events in Java Mission Control
Let’s launch Java Mission Control and open the JFR file by navigating to File > Open File menu item.
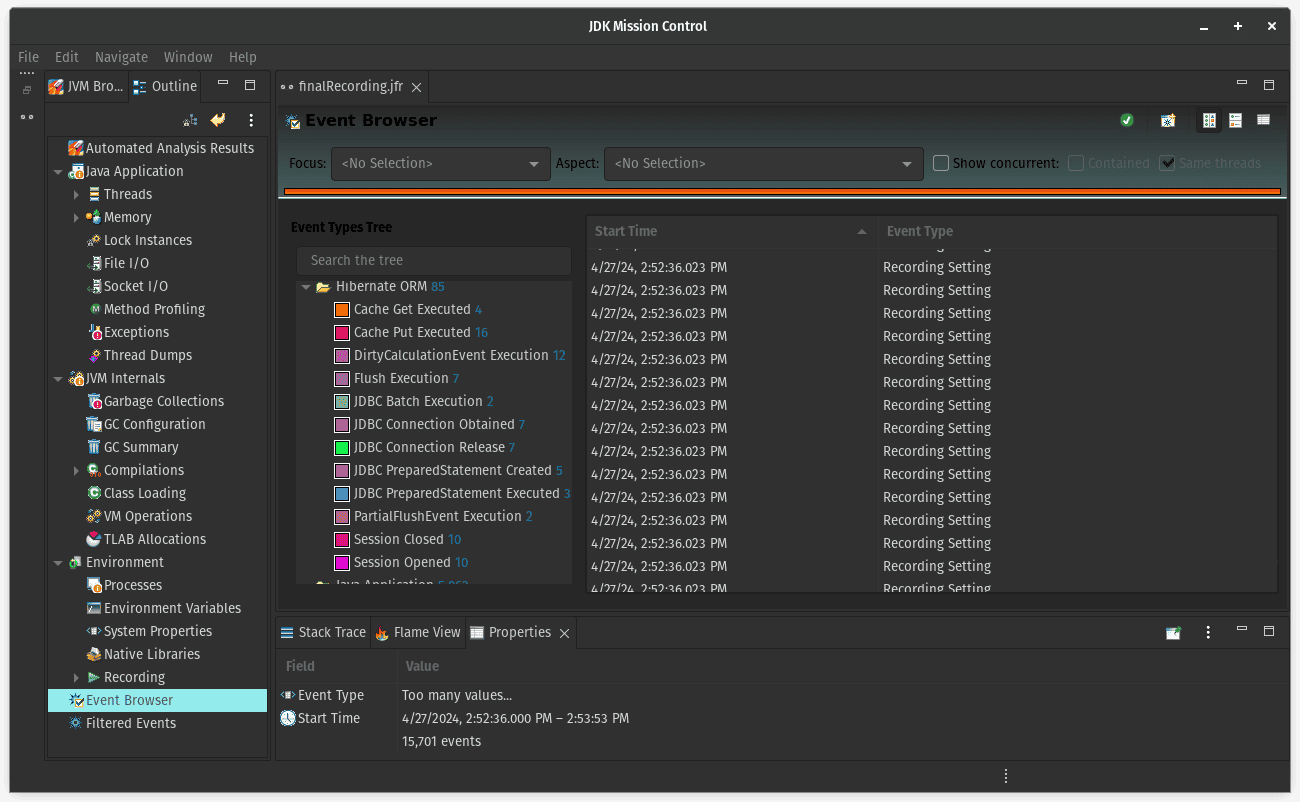
After loading the file, we see a landing page with Automated Analysis Results. This page provides a window into the application’s behavior and allows for a quick review. However, to see the events raised by Hibernate, we navigate to the “Event Browser” in the “Outline” pane and look for “Hibernate ORM”, under the Event Types Tree section:
5.2. Grouping Related Hibernate ORM Events in JDK Mission Control
Now let’s right-click on the Hibernate ORM heading under Event Types Tree and click on the “Create New Page Based on the Selected Event Types” context menu. This action creates a new page called “Filtered Events” on the Outline sidebar which displays all the Hibernate Events. We may rename the Filtered Events page as we see fit.
We can now open the new Filtered Events page, right-click on any row on the table, and select Group By > Event Thread. This action groups all events in the table based on the Event Thread property. Grouping by Event Thread is a very effective way to aggregate related events in an imperative programming paradigm:
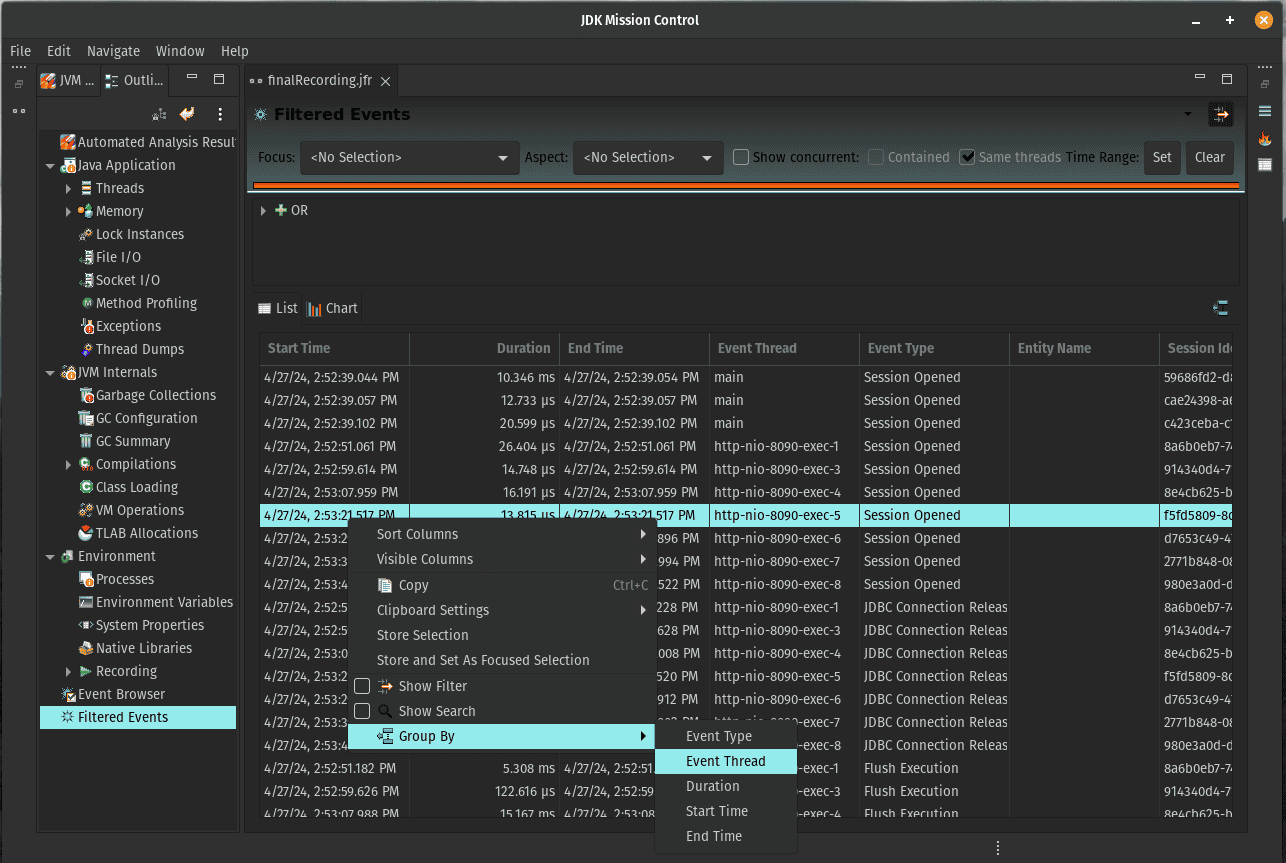
In a reactive or multithreaded paradigm, we should be cautious before grouping by Event Thread, as this can produce incoherent results because different threads might have computed related application logic.
5.3. Basic Analysis of Hibernate ORM Events in JDK Mission Control
Grouping events by event threads reveals a new section above the table, showcasing the grouped events. Next, we add another column to this table, by right-clicking on the headers, and choosing Visible Columns > Total Duration. The Total Duration column helps identify the threads that took longer to execute:
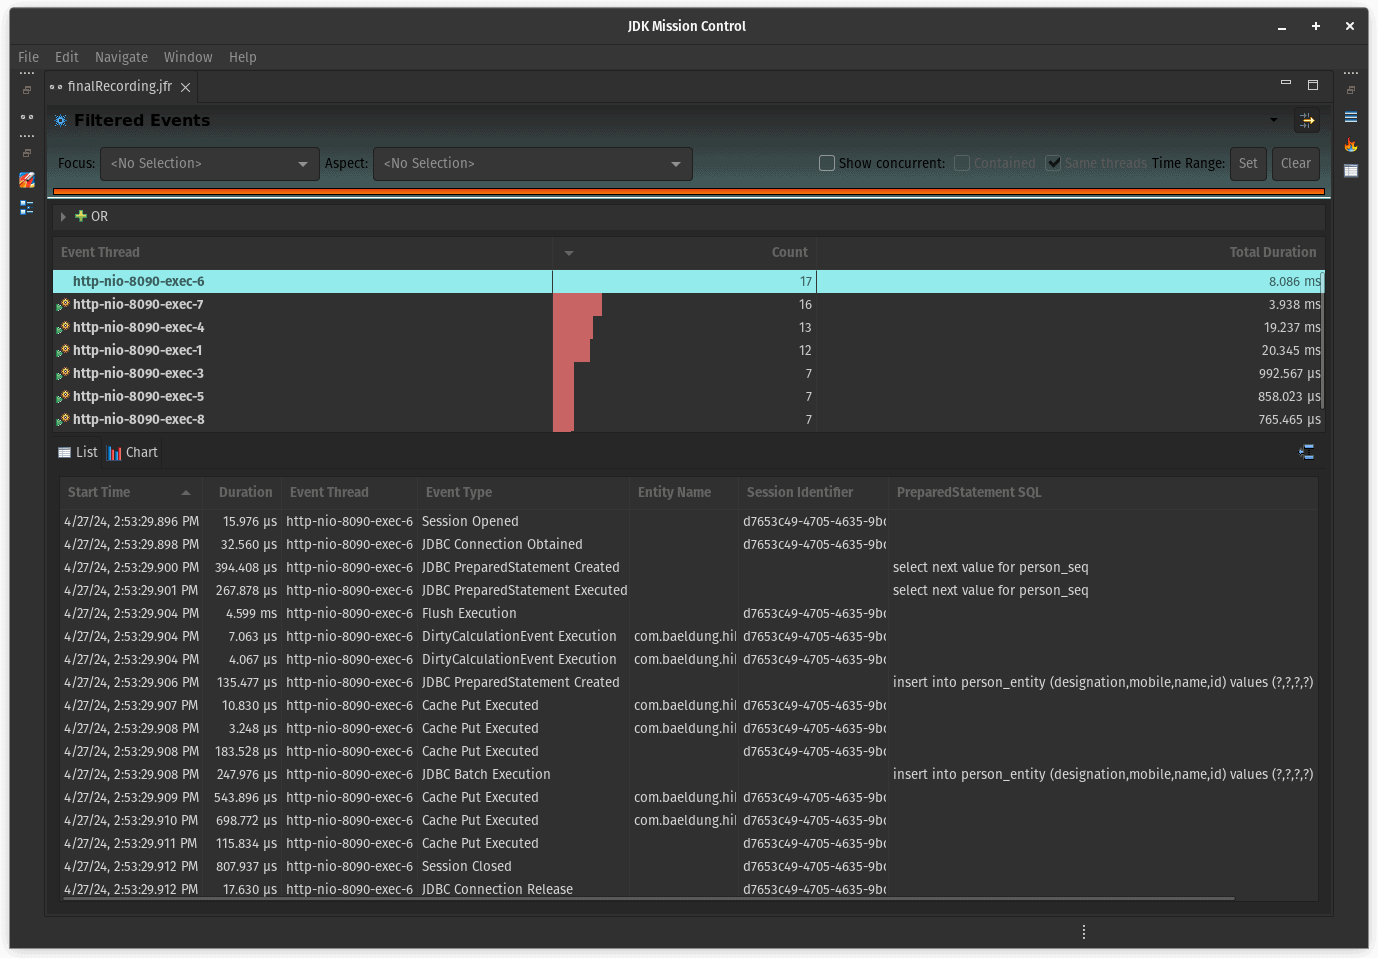
Selecting the Event Thread with the maximum “Total Duration” now reveals all the events that contributed to the time. And if we sort the event list by “Start Time”, we can visualize the sequence of events in Hibernate.
In the above case, we can see that of all the captured events, the execution and creation of the JDBC statements contributed to the majority of the “Total Duration” followed by “Cache Put Events“. We can also see the JDBC queries executed.
6. Conclusion
In this article, we briefly reviewed the Java Flight Recorder agent from Oracle and understood the process of emitting Hibernate JFR events from a Spring Boot application. We also performed a basic analysis of the flight recording file captured from the application with the JDK Mission Control tool and visualized which parts of the Hibernate ORM were taking longer. We noted the order of events that happened in the ORM layer and the JDBC queries executed.
The source code of the sample application and JFR files is available over on GitHub.